Home > CCA2 > Chapter A > Lesson A.1.2 > Problem A-27
A-27.
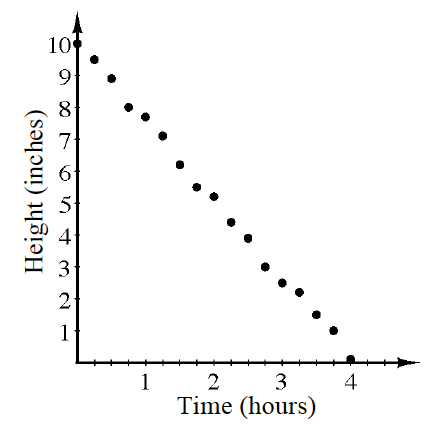
At an aunt’s wedding, Nicolas collected data about an ice sculpture that was about to completely melt. A graph of his data is shown at right.
Calculate the equation of a line of best fit.
Use
. Based on your equation, how tall was the ice sculpture one hour before Nicolas started measuring?
Read this question carefully.
inches