Home > CCA2 > Chapter A > Lesson A.1.3 > Problem A-40
A-40.
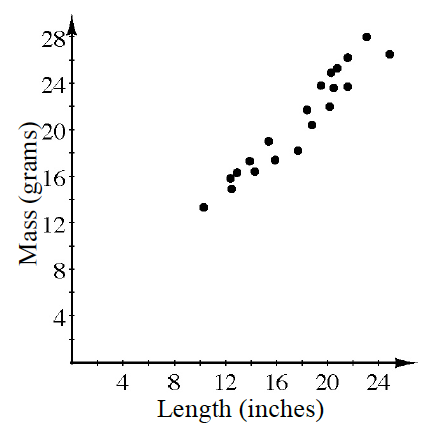
The graph at right shows a comparison of the length of several gold chain necklaces (including the clasp) to the total mass.
Write an equation for the line of best fit.
Hold a straight-edge up to the graph to create a line and estimate the slope and
-intercept. is one possibility. Based on your equation, what would you expect to be the mass of a
inch chain? Use the rule you wrote in part (a).
Which variable represents mass,or ? About
grams.