Home > CCA2 > Chapter B > Lesson B.1.3 > Problem B-34
B-34.
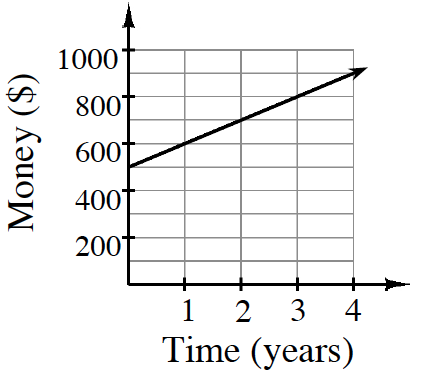
Your banker shows you the graph at right to explain what you can earn if you invest with him. Does this graph represent simple or compound interest? How can you tell? Write an equation to represent how much money you would have as time passes. Make sure you write a “let” statement.
Simple interest means that you would be getting interest at a constant rate. Compound interest means the interest is accruing exponentially. Look at the Math Notes box from this lesson for help in deciding if this is simple or compound interest.
This graph depicts simple interest. Make sure you explain why, and write a ''let'' statement to go with your equation.