

Home > CCA2 > Chapter C > Lesson C.1.1 > Problem C-11
The GPAs of a sample of
Find
Remember, a five number summary is the minimum, first quartile, median, third quartile, and maximum.
In this set, those would be thest, th, mean of the th and th, th, and th numbers, respectively. Minimum:
First Quartile:
Median:
Second Quartile:
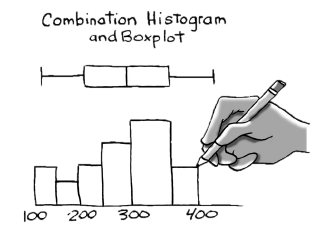
Maximum:On grid paper, create a combination histogram and boxplot. Use an interval of
on the -axis. (A combination histogram and boxplot starts with a histogram. Then place a boxplot on top of the histogram. Refer to the Math Notes box for this lesson, if needed. Use the same -axis scale for both the histogram and the boxplot.) An example combination histogram and boxplot has been provided.
Describe the center, shape, spread, and outliers. To review descriptions of “shape,” see the Math Notes box in C.1.2. To describe “spread” use the IQR, reviewed in the Math Notes box in this lesson.
Where is the center? Are most of the points concentrated there?
How many peaks are there? Are there equal amounts of points on either side of the peak?
Are there any places where the details much more concentrated than anywhere else?
Are there any points far from all of the others?The center is at about 2.9-3. The histogram is single-peaked and symmetrical.
The data is most concentrated in the middle. What else can you say about the graph?