Home > CCA2 > Chapter C > Lesson C.1.3 > Problem C-56
C-56.
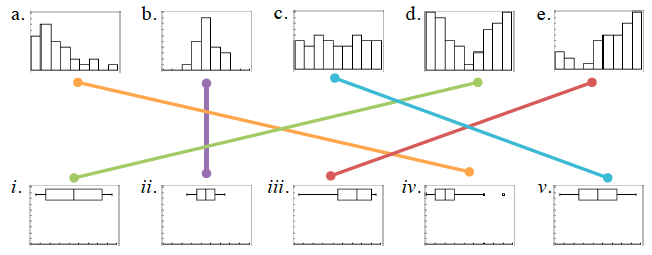
Match the histogram to its corresponding boxplot.


Notice where the maximum and minimum values are, and keep in mind how the concentration of data on a histogram translates onto a boxplot.
Where the columns on a histogram are taller, the segments of the boxplot will be shorter. If the data is skewed to one side, the median and quartiles will be closer to that side.