CPM Homework Banner
C-59.

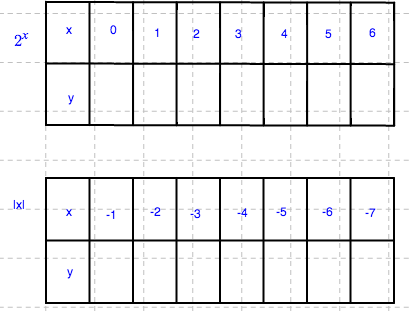
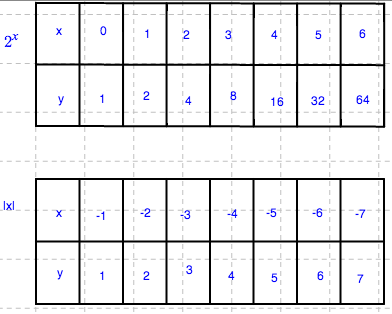
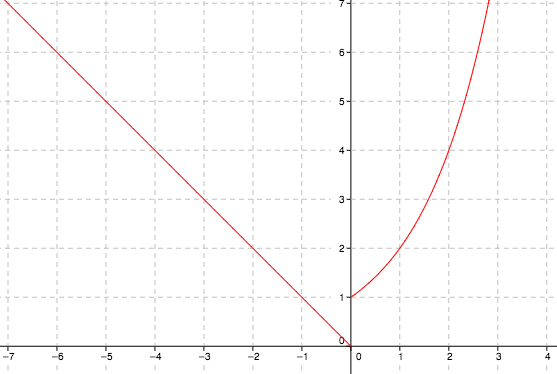
Graph the piecewise function .

Start by making a table of points for each of the two parts of the function.

2 - x, y, tables. Top: expression, 2 raised to the x, top row: x, 0, 1, 2, 3, 4, 5, 6. bottom row: y. Bottom: expression, absolute value of x, top row: x, negative 1, negative 2, negative 3, negative 4, negative 5, negative 6, negative 7, bottom row, y.

Added to the top, x, y table, in second row: y, 1, 2, 4, 8, 16, 32, 64. Added to the bottom, x, y table, in second row: y, 1, 2, 3, 4, 5, 6, 7.

Piece wise graph: left side, line segment from the point (negative 7, comma 7), to the origin. right side: increasing curve, opening up, starting at the point (0, comma 1), & passing through the point (1, comma 1), & (2, comma 4).