

Home > CALC > Chapter Ch3 > Lesson 3.3.4 > Problem 3-131
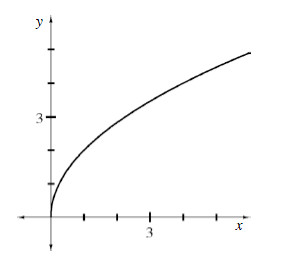
The graph of
means the average rate of change between
Graphically, this can be seen as the slope of the secant line. Is that slope positive, negative or zero? How does it compare with the slopes at
Looking at the graph from left to right, it is increasing always. The slopes start steep and, as
Use the eTool below to help solve the problem.
Click the link at right for the full version of the eTool: Calc 3-131 HW eTool