

Home > CALC3RD > Chapter Ch1 > Lesson 1.2.3 > Problem 1-59
1-59.
Each of the continuous functions in the table below is increasing, but each increases differently. Match each graph below with the function that grows in a similar fashion in the table.
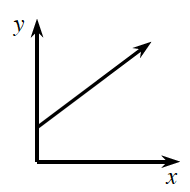
Graph (a) is linear. Straight lines grow at a constant rate. Which function on the table is growing at a constant rate.
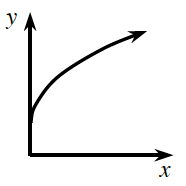
Graph (b) is increasing (the
-values are going up), but it is getting less and less steep as it increases. Which function is getting less and less steep? Steepness can be determined by rate of change:
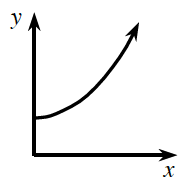
Graph (c) is increasing (the
-values are going up), AND it is getting more and more steep as it increases.
Use the eTool below to create the graphs of the functions.
Click the link at right for the full version of the eTool: Calc 1-59 HW eTool