CPM Homework Banner
1-174.

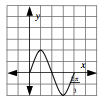
A focus of this course will be determining maximum and minimum values of a function on a given interval. However, you already have the skills to do this for certain functions. On your paper, sketch for . Determine the points at which the function is a maximum and a minimum.

See graph at right.

The graph is a sine curve that is vertically stretched by a factor of and horizontally compressed by a factor of .

Periodic curve, x axis scaled from 0 to 2 thirds pi, with 3 equally spaced tick marks, starting at the origin, rising to 2 at the first tick mark, passing through the x axis at the second tick mark, falling to negative 2 at the third tick mark & returning to the x axis at 2 thirds pi.