

Home > INT3 > Chapter Ch3 > Lesson 3.1.1 > Problem 3-23
LIAR, LIAR, PANTS...
A random sample of
Measured | Marked | Difference |
|---|---|---|
Create a graphical representation of the data represented in the “difference” column.
Use the eTool below to solve the problem.
Click the link at right for the full version of the eTool: 3-23 HW eTool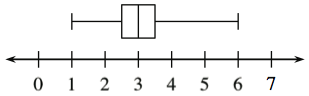
Describe the center, shape, spread, and outliers of the distribution.
See the diagram in part (a).
What likely conclusions can you draw from this data?
Think of why a company might adjust the sizes of their pants.
Use the eTool below to solve the problem.
Click the link at right for the full version of the eTool: 3-23 HW eTool