

Home > INT3 > Chapter Ch7 > Lesson 7.2.4 > Problem 7-94
Katelyn records the number of cups of coffee sold at her coffee shop each hour during a
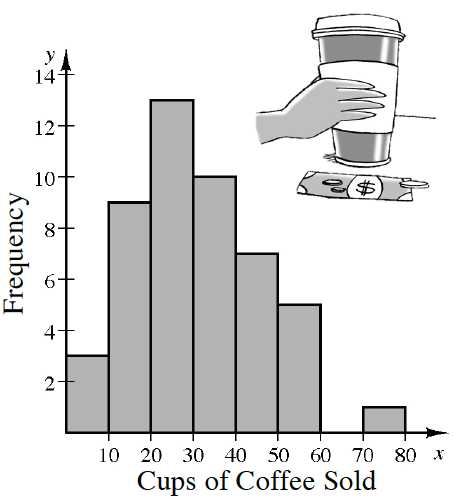
Katelyn decides to model her sales with a normal distribution, but Duncan thinks that this is not a good idea. What advice would you give Katelyn about using a normal model?
The data should be symmetric, single-peaked, and bell-shaped. Is it?
Katelyn needs to sell more than
cups of coffee per hour to make a profit. What percentile is cups per hour? Explain the percentile to Katelyn in terms of profits. Look at the data. How many data points sold less than
cups of coffee?
Compare this to the total number of data points.Duncan thinks Katelyn should expand her business. He estimates that if Katelyn hires another server and adds more tables and equipment, she will need to sell
cups of coffee per hour to make a profit. What percentile does cups sold represent? Use the percentile to explain to Duncan whether or not expansion is a good idea. Use the same method as you did in part (b).
Note that this time it may be easier to count data points that sold more thancups.
Cups of Coffee Sold | ||
checksum | ||