Home > APCALC > Chapter 1 > Lesson 1.3.1 > Problem 1-108
1-108.
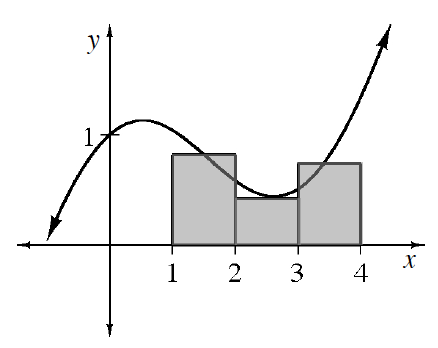
To estimate the area under a curve, rectangles are often the easiest shape to use. However, there are different ways to choose the heights of the rectangles. You have already used left endpoint and right endpoint rectangles. Another way is to use midpoint rectangles, which have heights defined at the midpoints of the intervals. For example, for the function
Calculate the height of the other two rectangles then use them to approximate the area under the curve for
Use your calculator to find the values of
The base of each rectangle is