Home > APCALC > Chapter 1 > Lesson 1.4.2 > Problem 1-160
1-160.
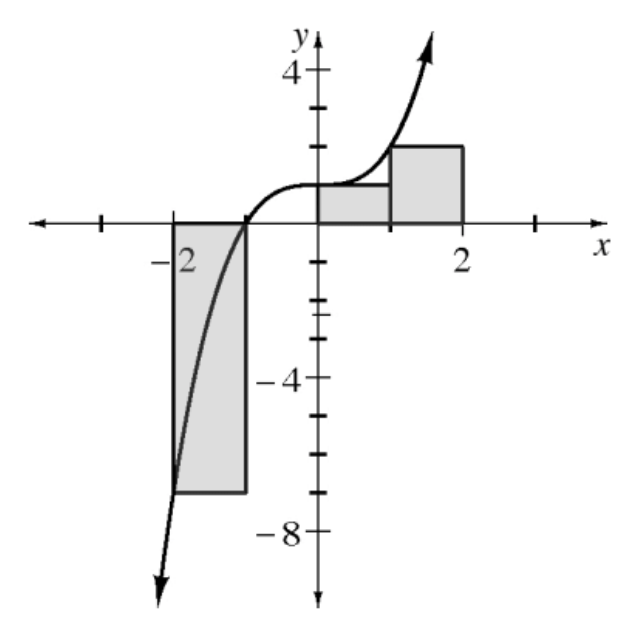
The function
Why does it look like there are only three rectangles?
What happens if the left endpoint is on the
-axis? Since
, the height of the rectangle is . Recall that area under the
-axis is negative, while area above the -axis is positive. Approximate the area under the curve for using these four rectangles. Sum the areas of all four rectangles together. Remember to treat a rectangle's area as negative if it is below the
-axis.