

Home > APCALC > Chapter 1 > Lesson 1.4.3 > Problem 1-167
1-167.
Oil is leaking out of a car at a rate of
Sketch a graph of this situation. Label the units on the axes.
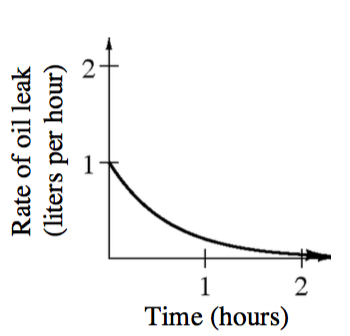
Shade the area under the curve for
. What does the shaded area represent? What are the units? Liters per hours multiplied by hours equals __________________ ?
The number of liters that leaked out between
and hours. The units are liters. Use two left endpoint rectangles to approximate the amount of oil that has accumulated during the first hour.