CPM Homework Banner
2-52.

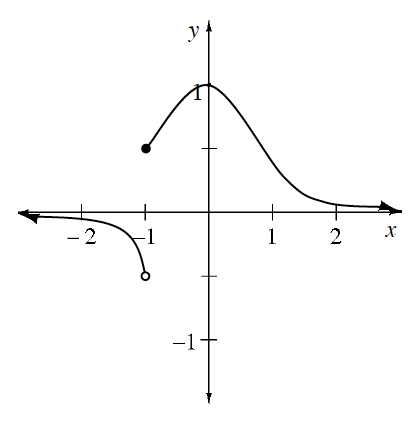
Write as many limit statements as you can about the function graphed at right as and .

Limits give information about the location of holes and asymptotes, because they are predicted values, not real values.

An Intuitive Definition of Limit

When you graph a function , most of the time you can guess what the value of, say, is by knowing the values of  when is very close to . One way to think about this is to assume you have the graph for , except at . Can you make a reasonable accurate guess as to the value of  ? If so, and this value is , we say that the limit of exists at and use the notation  .

For example, if , and , it is reasonable to guess that and therefore .

You can also take one-sided limits using numbers less than (the notation is ) or greater than (the notation is ).

An important point is that does not need to equal .


Piecewise, left curve, coming from left below x axis, opening down, ending at open point (negative 1, comma negative 1 half), right curve, starting at closed point (negative 1, comma 1 half, turning at the point (0, comma 1), changing from opening down to opening up at the point (1, comma 1 half, continuing to the right above the x axis