Home > APCALC > Chapter 2 > Lesson 2.2.3 > Problem 2-86
2-86.
The manager of Books-To-Go knows that the rate of daily sales (in books per day) varies over the course of a week. This rate can be represented by the step function shown in the graph below. Using this data, calculate how many books this store sold during this week. What is the average number of books sold per day?
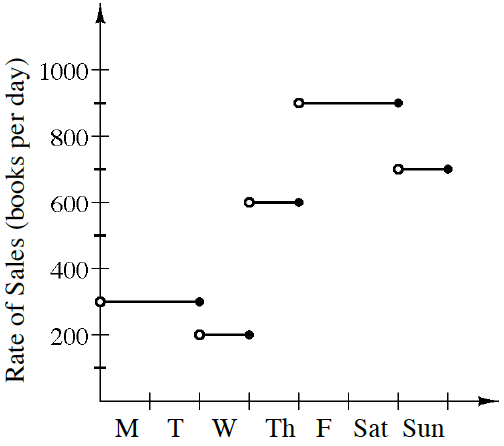
How is the number of books sold represented geometrically on this rate graph?