Home > APCALC > Chapter 2 > Lesson 2.4.1 > Problem 2-140
2-140.
WHICH IS BETTER? Part Three
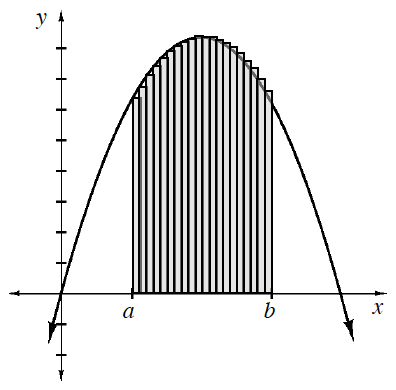
Below is a comparison of using different numbers of rectangles to approximate the same area under a curve for
If, in each situation, the rectangles all have equal widths, write expressions to approximate the areas under the curves.
Look at the shaded area beneath each curve. Which sketch most accurately represents the actual area under the curve?
General form for left-endpoint Riemann sum using sigma notation:
rectangles 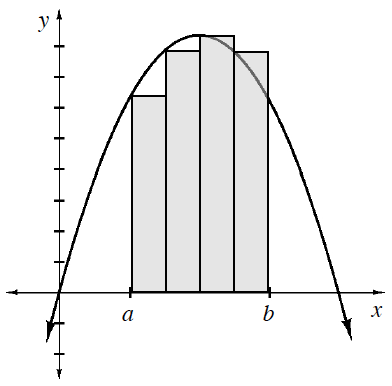
rectangles 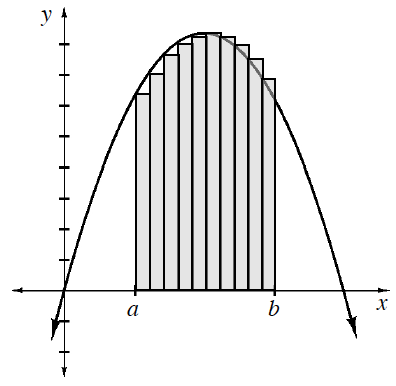
rectangles