CPM Homework Banner
3-79.

Calculate the average velocity between and seconds for each of the graphs below.

  1. First quadrant, x axis labeled, time, seconds, y axis labeled distance, m, increasing upward curve, starting at the origin, passing through the highlighted point (50, comma 37.8).

  1. First quadrant, x axis labeled, time, seconds, y axis labeled distance, m, curve starting at the origin, turning at the following approximate points, down at the point (5, comma 10), up at the point, (10, comma 0), down at the point (30, comma 45), up at the point, (42, comma 35), continuing up & right passing through the highlighted point (50, comma 37.8).

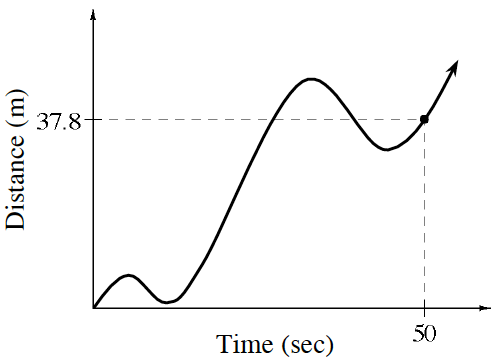
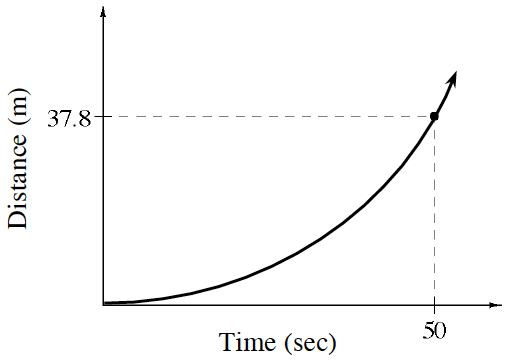
    This graph shows both forward and backwards motion. Will that affect average velocity?