Home > APCALC > Chapter 3 > Lesson 3.3.1 > Problem 3-90
3-90.
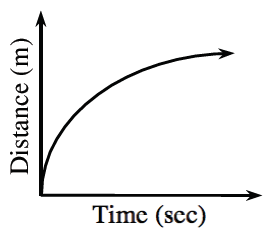
The graph below shows the distance from a fixed point traveled by a toy car. Use the graph to sketch the velocity of the car.
Is the velocity graph going to have positive
As
Does the velocity ever reach