Home > APCALC > Chapter 3 > Lesson 3.3.2 > Problem 3-103
3-103.
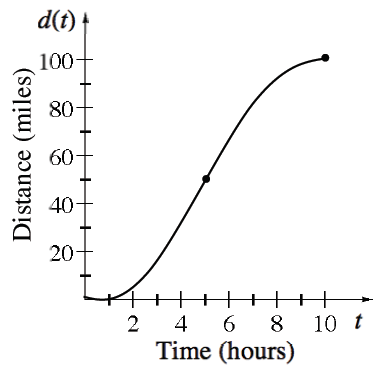
The graph at right shows the distance a bicyclist travels from Oshkosh to a town
Describe the velocity of the bicyclist.
The velocity is the slope of a distance graph.
The velocity is always positive. The bicyclist accelerates between
and and then decelerates between and . S/he is moving fastest at . What is the bicyclist’s average velocity?
Average velocity between
and Approximate the bicyclist’s instantaneous velocity at
hours. IROC at a point
slope of the tangent line at that point.