Home > APCALC > Chapter 3 > Lesson 3.3.2 > Problem 3-109
Curves can be labeled with descriptors such as “concave down” and “increasing.” On graph paper, graph each function and label its respective parts. Use different colors to represent concavity.
Curve Analysis
A function is increasing on an interval if
One way to determine if a function is increasing or decreasing is to determine the domain on which the slope of its tangent lines,
For example give
The coordinate point where a function changes from increasing to decreasing or vice versa is called an extrema. This extreme point is either a maximum or a minimum. The function graphed at right has extrema at
Note: If a function is increasing or decreasing over its entire domain, the function is monotonic.
When the slopes of the tangent lines increase on an interval, the graph is concave up because it curves up. However, when the slopes decrease on an interval, the graph is concave down because it curves down.The graph of
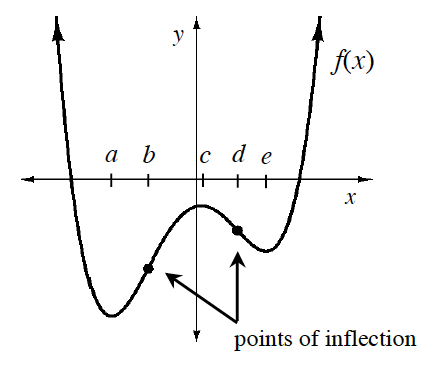
A coordinate point where the concavity changes is called a point of inflection. At this point, the curve changes from concave up to concave down or vice versa.