CPM Homework Banner
3-115.

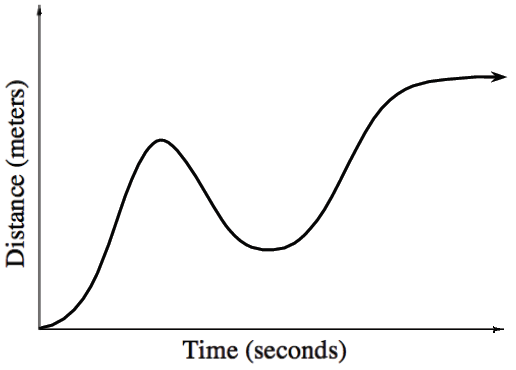
The graph at right shows the distance from a fixed point traveled by a toy car. Use the graph to sketch a velocity graph for the car. 

Notice that shortly into the car's journey, it changed directions and started moving back towards its starting position. How will this be reflected on a velocity graph?

A steep negative slope on a distance graph will be plotted as a very low -value on a velocity graph. A steep positive slope on a distance graph will be plotted as a very high -value on a velocity graph. No slope on a distance graph will be plotted on the -axis of the velocity graph.

First quadrant, x axis labeled time, seconds, y axis labeled distance, meters, continuous curve starting at the origin, opening up, changing concavity, turning down, changing concavity, turning up, changing concavity, then leveling off higher than first turning point, continuing to the right.