Home > APCALC > Chapter 4 > Lesson 4.3.1 > Problem 4-110
4-110.
The three graphs below each tell a story. Examine each graph carefully and then complete each part below. Pay close attention to the labeling of the
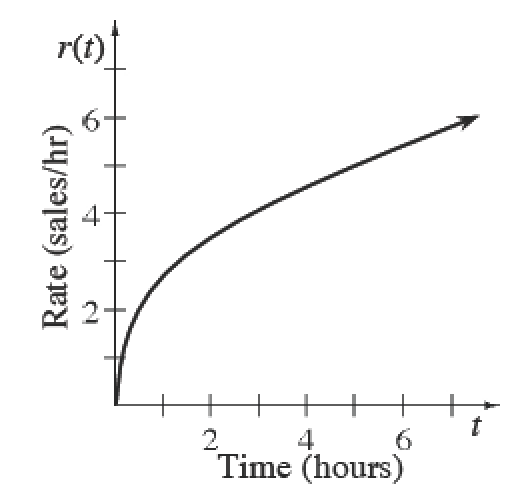
The graph of
involves a bicycle. Use a complete sentence to describe the physical meaning of . Include units of measure.
The graph of
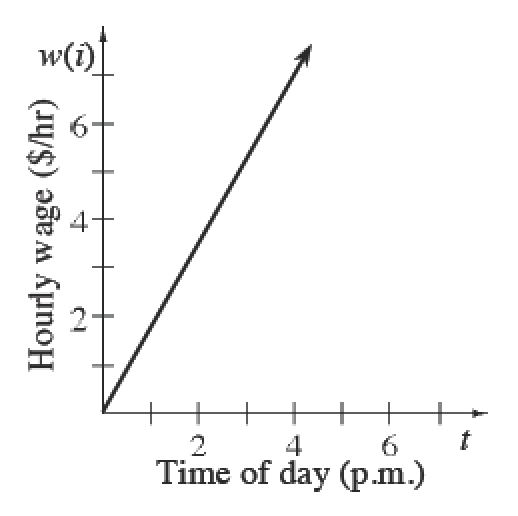
involves an employee of a calculator company. Use a complete sentence to . Include units of measure. indicates a rate graph and an integral is an area function.
Be sure to mention the significance of the bounds.
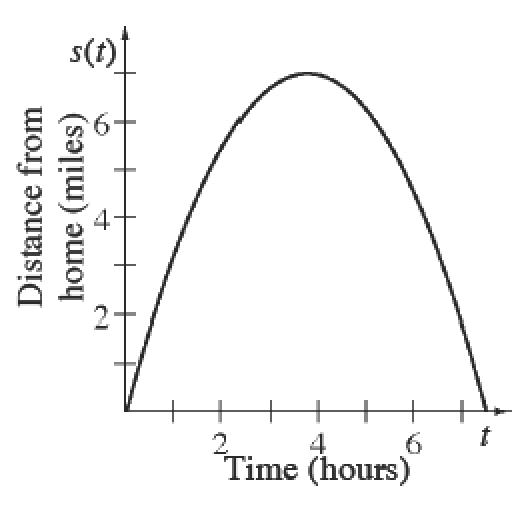
The graph of
involves a babysitter. Use a complete sentence to describe the physical meaning of . Include units of measure. Refer to the hints in part (b).