Home > APCALC > Chapter 4 > Lesson 4.3.1 > Problem 4-111
4-111.
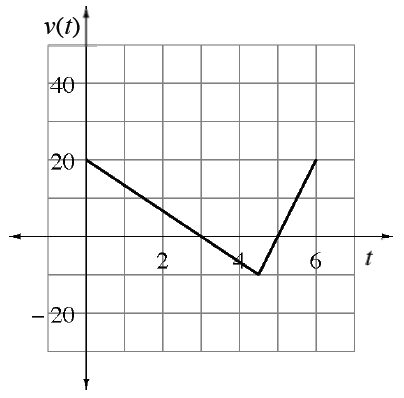
The graph at right shows the velocity (in miles per hour) of a car during a road trip. At time
Write a function for
. Write an equation for each line segment.
How far north has the car traveled at
hours? At hours? Since this is a velocity graph, calculate the area under the curve for the given interval.
Explain what happened to the car for
hours. For
, the function values are negative. This is a velocity graph, so what does negative velocity tell you about position? Set up an integral to represent the displacement from
. Set up an integral to represent the total distance from
.