

Home > APCALC > Chapter 5 > Lesson 5.1.2 > Problem 5-17
5-17.
The curves below are pieces of position vs. time graphs. For each curve, sketch the graph of the second derivative and describe what it tells you about the motion of the object.
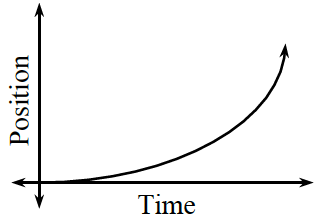
On this graph, the 2nd derivative represents acceleration.
On any graph, the 2nd derivative represents slopes of the slope (concavity).
Is this graph concave up or concave down?
That will help you decide whether you should plot positive or negative values.
Are the slopes of this graph increasing or decreasing?
That will help you decide the shape of the 2nd derivative graph.
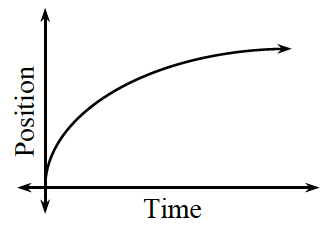
Use the same logic as in part (a).