

Home > APCALC > Chapter 5 > Lesson 5.1.3 > Problem 5-25
5-25.
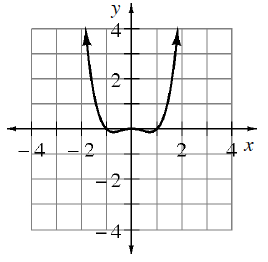
Use the graphs of
Local max at
Inflection points at
Local min at
See the hint in part (a).
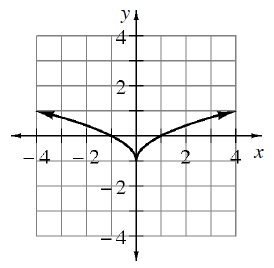
Use the graphs of
Local max at
Inflection points at
Local min at
See the hint in part (a).