

Home > CALC > Chapter 1 > Lesson 1.1.1 > Problem 1-6
1-6.
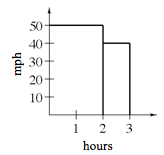
A car travels
Sketch a graph of velocity vs. time. Label the axes with units.
Plot time on the
-axis and velocity on the -axis. Notice that velocity is constant for the first two hours, and then has a different constant value for the remaining hour. What do constants look like on a graph?
Fill out the table below for the distance vs. time.
Time
Distance
Consider the Freeway Fatalities problem 1-1... Recall that distance information can be found by calculating the area under a velocity graph.
Time
Distance
Graph the function of distance vs. time. Label the axes with units.
Graph the data in the table and connect.
Note that distance is measured in miles and time is measured in hours.