

Home > CALC > Chapter 1 > Lesson 1.2.2 > Problem 1-36
The graph of
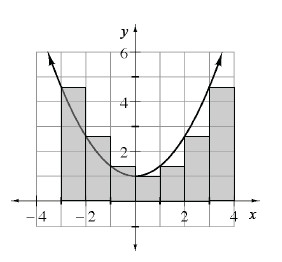
Approximate
by finding the sum of the areas of the left endpoint rectangles as shown. (The height of a left endpoint rectangle is determined by the function's height at the left - value.) Notice that the right-most rectangle shown in the picture is not included in the given domain
. The area of each rectangle can be determined by
The base, , of each rectangle is .The height, , of each rectangle can be determined by the function: . __________ Is the approximation from part (a) too high or too low? How can you tell?
This is a hard one to visualize. Remember to consider only domain
. Does it appear that the rectangles contain more area than the area under the parabola or less? Now, sketch this function with
right endpoint rectangles and compute the approximate area. A = (0.4(−3)2 + 1) + (0.4(−2)2 + 1) + (0.4(−1)2 + 1) + (0.4(0)2 + 1) + (0.4(1)2 + 1) + (0.4(2)2 + 1) = 13.6
You should have found the same answers using right and left endpoint rectangles. Would this be true for all functions? If so, explain why. If not, explain what was special about the function above that made the area estimates equal. Give an example of a case where the area estimates would be different.
Consider the symmetry of the parabola on the given domain.
Use the eTool below to view the graphs.
Click the link at right for the full version of the eTool:. Calc 1-36 HW eTool