

Home > CALC > Chapter 1 > Lesson 1.3.1 > Problem 1-109
WHICH IS BETTER? Part One
Below are different sets of rectangles to approximate the same area under a curve for
Explain why your choice will determine the best approximation for the area.
Which graph is the closest to the exact area under the curve?
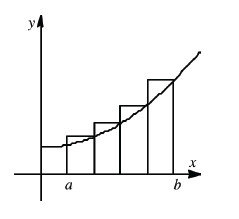
Midpoint Rectangles
Will left endpoint rectangles always be an underestimate for any function? Explain.
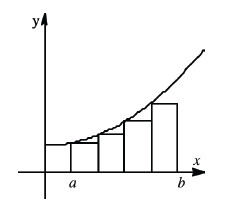
Left Endpoint Rectangles
Midpoint Rectangles
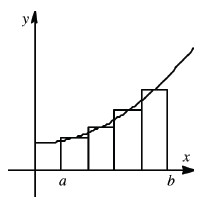
Right Midpoint Rectangles
Notice that the graphs in the diagrams above show an increasing function. That is, as
increases, the -values increase. What if we graphed a decreasing function instead? Would left-endpoint rectangles be underestimates then?