Home > CALC > Chapter 4 > Lesson 4.2.3 > Problem 4-75
4-75.
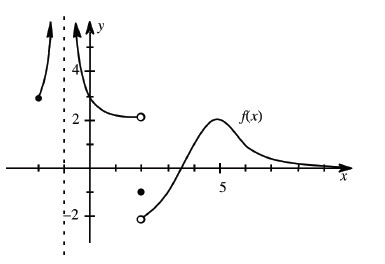
The graph of a function
The limit does not exist, but
.
A limit is a predicted value (which sometimes differs from the actual function value). The prediction must agree from the left and the right.
What is the prediction from the left?
What is the prediction from the right?
Most of the time, the limit and the function value agree.
and will reveal the equation of a horizontal asymptote, if there is one.
Where (if anywhere) does the derivative of
not exist? Look for cusps, endpoints, jumps, holes, and vertical asymptotes.