

Home > INT1 > Chapter 1 > Lesson 1.3.2 > Problem 1-83
1-83.
Which of the graphs below represent functions? Justify your answer.
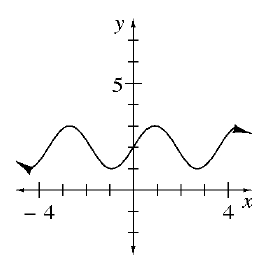
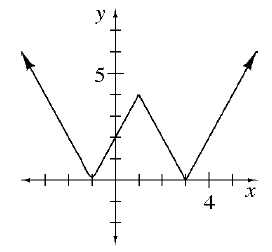
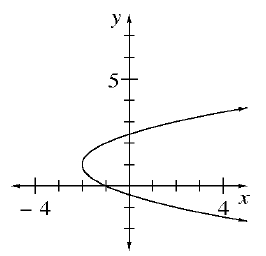
Do all of these graphs have one output value for every input value?
For each graph above, state the domain and range.
The domain of a graph is its possible
-values. All real numbers.
The range of a graph is its possible y-values.