CPM Homework Banner
11-63.

Match the histogram to its corresponding boxplot.

  • Your teacher will provide you with a model of the graph.

  • Your teacher will provide you with a model of the graph.

  • Your teacher will provide you with a model of the graph.

  • Your teacher will provide you with a model of the graph.

  • Your teacher will provide you with a model of the graph.

  • Your teacher will provide you with a model of the graph.

  • Your teacher will provide you with a model of the graph.

  • Your teacher will provide you with a model of the graph.

  • Your teacher will provide you with a model of the graph.

  • Your teacher will provide you with a model of the graph.

Notice where the maximum and minimum values are, and keep in mind how the concentration of data on a histogram translates onto a boxplot.

Where the columns on a histogram are taller, the segments of the boxplot will be shorter. If the data is skewed to one side, the median and quartiles will be closer to that side.
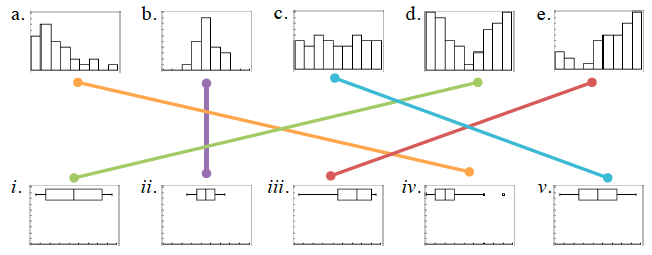
Answers: a to Roman numeral 4, b to Roman numeral 2, c to Roman numeral 5, d to Roman numeral 1, and e to Roman numeral 3.