

Home > INT1 > Chapter 2 > Lesson 2.2.3 > Problem 2-74
2-74.
Each part below represents a different situation. For each situation, determine the pattern of growth and the number of tiles in Figure 0 or the
tile | tile | |||
tile | tile | |||
tile | tile | tile | tile | tile |
tile | tile | |||
tile | tile | |||
Figure 2 | ||||
tile | tile | ||||
tile | tile | ||||
tile | tile | ||||
tile | tile | tile | tile | tile | tile |
tile | tile | ||||
tile | tile | ||||
tile | tile | ||||
Figure 3 | |||||
tile | tile | |||||
tile | tile | |||||
tile | tile | |||||
tile | tile | |||||
tile | tile | tile | tile | tile | tile | tile |
tile | tile | |||||
tile | tile | |||||
tile | tile | |||||
tile | tile | |||||
Figure 4 | ||||||
How many more squares does Figure 3 have than Figure 2?
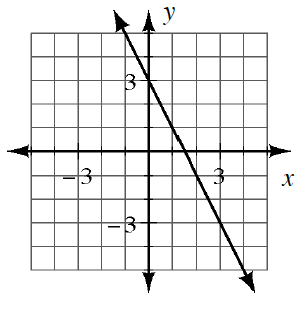
Make a slope triangle between two points on the graph to find the slope, or the growth rate.
Growth rate:
What is the difference between each
What is the value of
Which situation above is growing (increasing) at the fastest rate?