

Home > INT1 > Chapter 4 > Lesson 4.2.1 > Problem 4-62
Robbie’s class collected the following view tube data in problem 4-1.
Distance from wall (in) | Width of field of view (in) |
|---|---|
checksum | checksum |
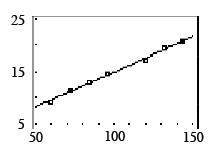
Use your calculator to make a scatterplot and graph the least squares regression line (LSRL). Sketch the graph and LSRL on your paper. Remember to put a scale on the
-axis and -axis of your sketch. Write the equation of the LSRL rounded to four decimal places. See scatterplot below.
Using your calculator, determine the residuals. Make a table with the distance from wall (inches) as the first column and residual (inches) in the second column. What is the sum of the squares of the residuals?
See table below.
Use your calculator to find the sum of the squares of the residuals.Distance from wall (in)
Residual (in)
144
-0.198
132
0.305
120
-0.391
96
0.316
84
0.219
72
0.123
60
-0.374