CPM Homework Banner
5-70.

The winning times for various swim meets at Smallville High School were compared to the height of the swimmers. The residual plot is shown below.
A residual plot with X axis labeled as Height in centimeters and Y axis labeled Residuals in seconds. The points on the left are spread away from the X axis. Moving to the right, the points cluster closer to the X axis until they are just above and below the axis on the right. Your teacher will provide you with a model of this graph.

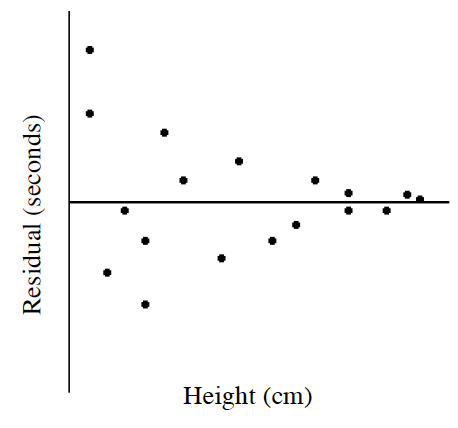
  1. Sketch what the original scatterplot may have looked like.

    A first quadrant scatter plot and increasing line of best fit with the X axis labeled as Height in centimeters and Y axis labeled as Swim Time in seconds. For shorter heights, the times are more spread out from the line and for taller heights, the times are closer to the line. Your teacher will provide you with a model of this graph.

  2. What does the residual plot tell you about predictions made about swimmers that are shorter compared to predictions made about taller swimmers?

    According to the graph, have predictions gotten closer to the actual values, or further away?