

Home > INT1 > Chapter 7 > Lesson 7.1.7 > Problem 7-83
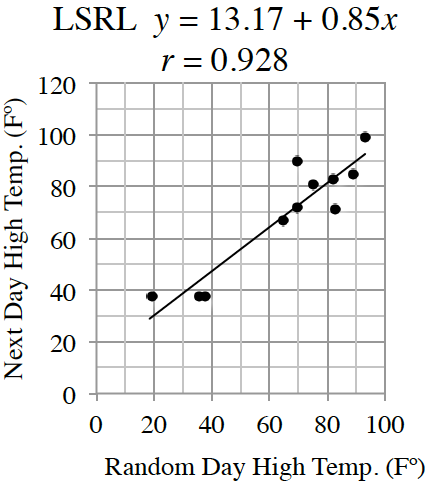
Mitchell likes to study the weather. He is fascinated by the sophistication of the computer models used to make weather predictions. Mitchell wonders if he can make his own model to predict the next day’s high temperature in his area based only on today’s high temperature. He selects
Random Day ( | Next Day ( |
|---|---|
Write a few sentences that describe the association. Remember to include interpretations of slope and
. Read Math Note box in section 4.2.4 on correlation coefficients and the meaning of R².
Also remember to look at the axis labels when working with slope.
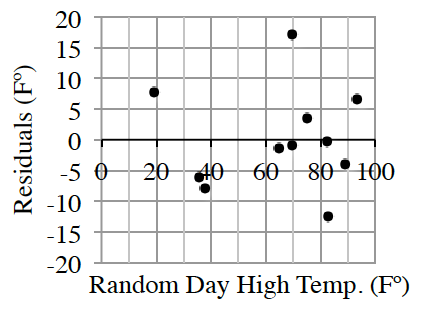
Be sure to discuss outliers as well.Use the graph to estimate the largest residual. To what point does it belong?
The largest residual belongs to the day after the
degree day with a value of about degrees. Using the
model, estimate tomorrow’s high temperature based on today’s high temperature of in Mitchell’s area. Use appropriate precision. Let
in the given equation. degrees because . Consider the upper and lower bounds of the prediction Mitchell made in part (c) above. Is Mitchell’s model ready to replace the complex models of the professional meteorologists? Support your answer.
Draw upper and lower boundary lines on the
graph. How far apart are these lines?