

Home > INT1 > Chapter A > Lesson A.1.3 > Problem A-35
The two lines at right represent the growing profits of Companies A and B.
Sketch this graph on your paper. If Company A started out with more profit than Company B, determine which line represents A and which represents B. Label the lines appropriately.
Company A's line should have a greater y-intercept, since they started with more profit than Company B.

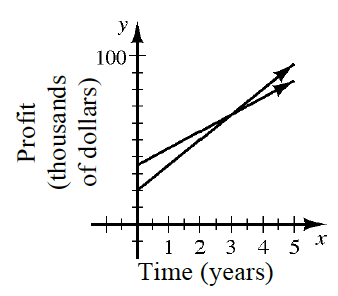
Are the profits of Company A a proportional situation? Why or why not?
In how many years will both companies have the same profit?
Find where the two lines intersect.

Determine the x-coordinate for this point.
years Approximately what will that profit be?
The profit is the y-coordinate of the intercept.
Each tick mark represents. Which company's profits are growing more quickly? How can you tell?
Growth is related to how steep a line is.
Which line is steeper?