

Home > INT2 > Chapter 11 > Lesson 11.2.1 > Problem 11-58
Genève is designing a video display for an aircraft instrument panel. One of her design requirements is that it must have full high-definition capability. However, space on the panel is very limited because of the many other critical instruments required for flying, so she would like the video display to be as small as practically possible. She collected data from manufacturers about available video screens currently used for phones and computers. For each screen she recorded the number of light emitting pixels on the screen in millions (
Make a scatterplot of the data.
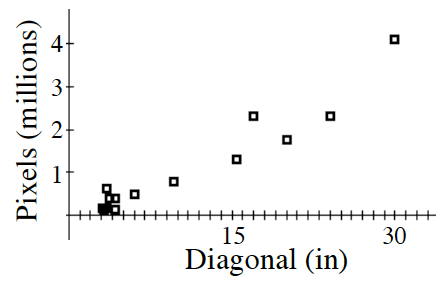
A curved relationship is apparent. Before doing any analysis using your calculator or other graphing technology, which type of curve do you think will be a better fit: exponential or quadratic? Why?
The number of pixels is determined by area. Area implies quadratic.
Use your calculator or other graphing technology to determine exponential and quadratic regression equations and add the exponential and a quadratic regression curves to your scatterplot.
Quadratic regression is
Genève learns that full HD resolution requires about
million pixels on the screen. Use your regression equation to determine what would be a reasonable estimate of the screen diagonal in inches required for full HD. Use
and solve for in the quadratic model. inches Explain at least one factor that may be causing this data to not fit your curved model exactly.
Answers vary but pixel display is not consistent.
Diagonal | Pixels |