

Home > INT2 > Chapter 3 > Lesson 3.1.2 > Problem 3-19
Eddie is arguing with Tana about the probabilities of different outcomes when flipping three coins. They decide to flip a penny, nickel, and a dime.
Which would be better for representing the sample space, a systematic list, a tree diagram, or an area model? Justify your answer.
There are three coins. Can you represent the outcomes of flipping three coins with a systematic list? An area model? A tree diagram?
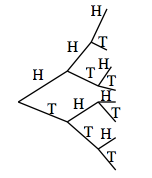
Tree diagram, but why?
Determine the sample space of all possible outcomes. How many outcomes are there?
Calculate the probability of each of the following events occurring. Be sure to show your thinking clearly.
Use the diagram from part (b) to answer parts (i) through (iv).
Three heads
One head and two tails
At least one tail
Exactly two tails
Which is more likely, flipping at least two heads or at least two tails? Explain.
Refer to the diagram.

Use the eTool below to test probabilities.
Click on the link at right for the full version of the eTool: Int2 3-19 HW eTool