

Home > INT3 > Chapter 1 > Lesson 1.1.4 > Problem 1-58
Gregory planted a lemon tree in his back yard. When he planted the tree, it was two feet tall. He notices that it has been growing three inches every week.
Create multiple representations to represent the relationship between the days that have passed and the height of the tree.
Remember, there are
inches in a foot. Start with a table. How tall is the tree on day
, the day it was planted? Use what you know about how it grows to generate the rest of the table. 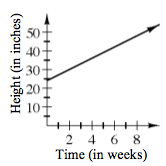
If the tree continues growing at this rate, when will it be six feet tall? How can you see this growth in each of the representations?
How many inches are there in
feet? Where do you see that on the table? On the graph? Describe it.
Substitute
for in the equation and solve for . weeks State the possible inputs and outputs of the graph.
Possible inputs: all number greater than and including
Possible outputs: all numbers greater than and including
Use the blank graph in the eTool below to help solve the problem.
Click the link at right for the full version of the eTool: Int3 1-58 HW eTool