Home > INT3 > Chapter 1 > Lesson 1.2.2 > Problem 1-100
1-100.
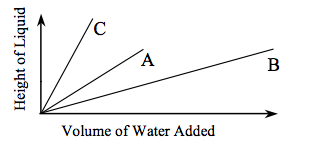
Imagine that you are adding water to the beakers shown below (labeled A, B, and C). Sketch a graph for each beaker to show the relationship between the volume of water added and the height of the water in each beaker. Sketch the graphs of all three situations on one set of axes (you may want to use colored pencils to distinguish the graphs). What are the independent and dependent variables?

To make the graph, think about it this way: if you poured the same amount of water into each beaker, which one would look more full? Less full?

Independent Variable: volume of water
Dependent Variable: height of liquid