

Home > INT3 > Chapter 1 > Lesson 1.2.3 > Problem 1-103
1-103.
Katelyn owns a
Katelyn sorted the data and made the histogram below.
Cups of Coffee Sold | ||
checksum | ||
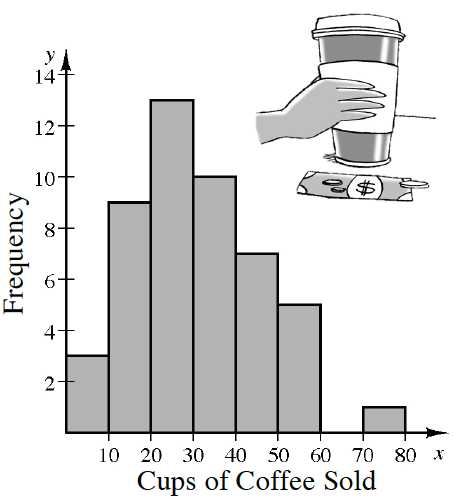
Using the sorted data from the table and the histogram, and without using your calculator, what is the five-number summary (minimum, first quartile, median, third quartile, maximum)?
For quartiles:
Look between theand the .
Look between thes.
Look between theand the . Minimum:
Maximum:Describe the distribution of coffee sales per hour
What would be the typical number of cups sold in an hour?
Does the distribution have skew? Is there an outlier?
What is the IQR? What would it represent?