Home > PC > Chapter 4 > Lesson 4.1.2 > Problem 4-31
4-31.
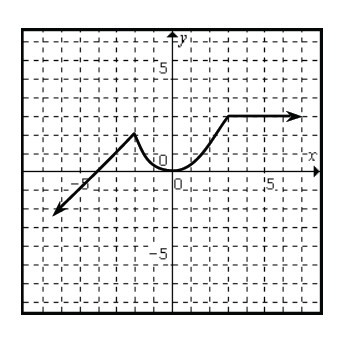
Using the graph at right of
The function value,
, is the -value. How does the graph change if is added to each -value? New function: If
, (new) is equivalent to from the original function. Also, what does multiplication by do to the function? See part (b). Also,
became , or became . in the original function occurs
whenin the new function.