

Home > PC > Chapter 5 > Lesson 5.2.3 > Problem 5-73
5-73.
Sketch the graph of
The parent graph of
What does that graph look like?
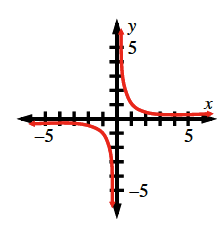
What does a negative sign do to a graph?
What about
Use the graph to evaluate the limit.
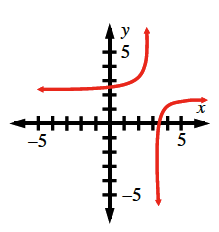
Sketch the graph of
The parent graph of
What does that graph look like?
What does a negative sign do to a graph?
What about
Use the graph to evaluate the limit.