

Home > PC3 > Chapter 2 > Lesson 2.3.1 > Problem 2-134
2-134.
Each of the curves graphed below is not a function. However, restricting the domain or range can turn a non-function into a function. Sketch a copy of each graph below onto your paper. Then highlight the largest portion of each curve that represents a function. In each case, did you restrict the domain or did you restrict the range?
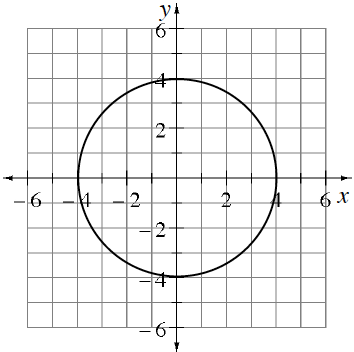
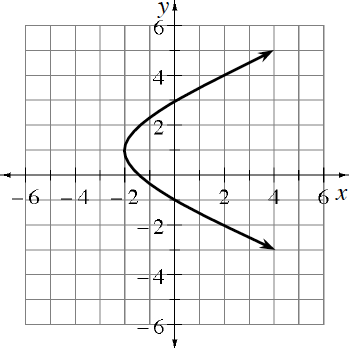
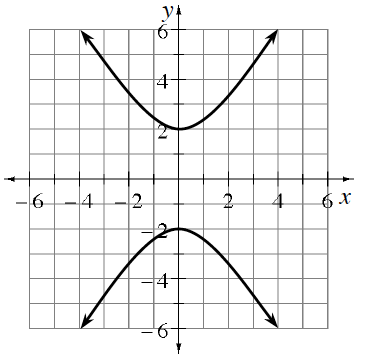
In each case, can enough of the domain be restricted to create a function?
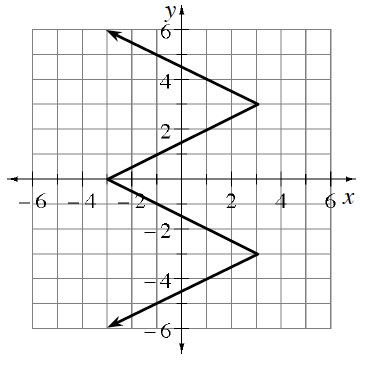
In each case, can enough of the range be restricted to create a function?