

Home > PC3 > Chapter 4 > Lesson 4.3.2 > Problem 4-121
4-121.
Why does this graph have this kind of shape?
When do most customers come in?
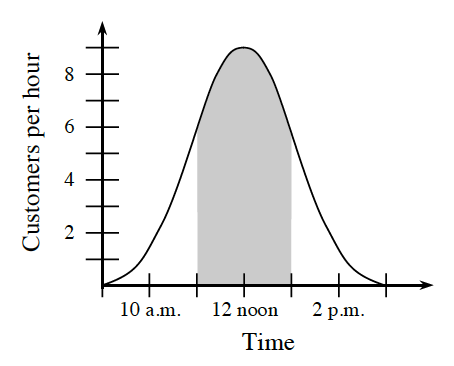
What does the area shown in the shaded region represent? (The interval of the shaded region starts at 11 a.m. and ends at 1 p.m.)
Ms. Spannoni thinks that they should hire an extra worker for the lunch rush (11 a.m. to 1 p.m.) if they have over
customers during that time. Should they hire an extra worker? What is the approximate area under the curve for the specified time interval?