CPM Homework Banner

Home > PC3 > Chapter 8 > Lesson 8.3.1 > Problem 8-93

8-93.

First quadrant graph, x axis labeled, number of days since story broke, y axis labeled, number of daily views, with the following 2 highlighted points: (0, comma 3600), & (2, comma 225), each labeled with its coordinates, & a third approximate point at (1, comma 900).When a news story breaks, it can generate a lot of interest, but it does not take long before another story diverts that interest. At right is a graph depicting the number of daily views for a news story about Syria and the United Nations.  

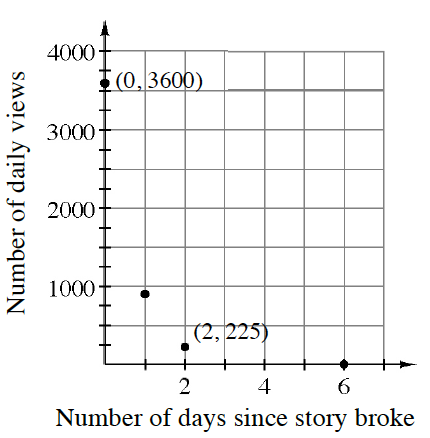
  1. Write an equation to model the situation.

    This is exponential decay. Write an equation of the form .

  2. If this model is typical of how interest declines for a news story, what is the half-life of interest in the story?

    Since there are initial views, determine how long until there are views.

  3. Write an equation that models this phenomenon for any initial value of views ().

    See the hint in part (a). Then let .