

Home > A2C > Chapter 14 > Lesson 14.9.1.2 > Problem 9-26
9-26.
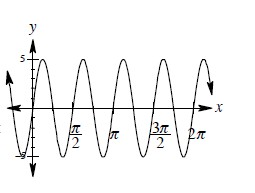
Consider the graph of
1. Change the amplitude to
2. There are now
So change the frequency '
Consider the graph of
1. Change the amplitude to
2. There are now
So change the frequency '