CPM Homework Banner

Home > A2C > Chapter 5 > Lesson 5.2.4 > Problem 5-100

5-100.

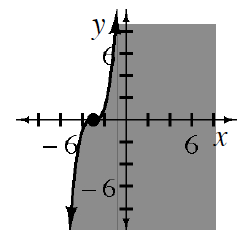
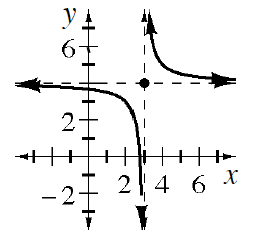
On separate pairs of axes, sketch the graph of each equation or inequality below.

  1.  

  1.  

    Increasing solid cubic curve, centered at (negative 3, comma 0), divides plane into 2 regions, region to the right is shaded.

  1.  

    Decreasing hyperbola, with asymptotes, x, = 3, &, y, = 4, showing as dashed. Left curve, opens down, below and left of asymptote intersection. Right curve, opens up, above & right of asymptote intersection.