

Home > AC > Chapter 3 > Lesson 3.1.1 > Problem 3-8
3-8.
GO GOLDEN GOPHERS!
The graph below describes the distance two cars have traveled after leaving a football game at the University of Minnesota.
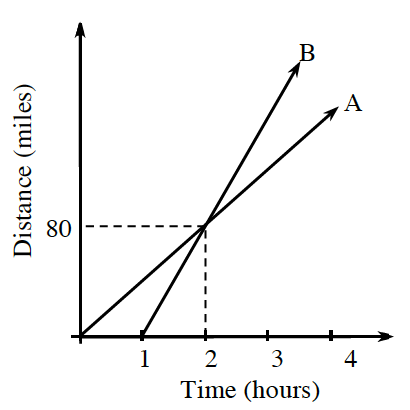
Which car was traveling faster? How can you tell?
You can find this by discovering which car traveled a greater distance in a shorter amount of time.
Car B was traveling faster.
Its line is steeper.
The lines cross at
. What does this point represent? What are the units for the
and coordinates? In
hours, both cars will be miles from the game. Assuming that Car A continued to travel at a constant rate, how far did Car A travel in the first
hours? Because Car A traveled
miles in hours at a constant rate, it went miles in hour.
If the Car A travelsmiles every hour, how far will it travel in hours?